Find Your Best-Value Colleges with These 5 College Admission Statistics

Spread the Knowledge. Share: ![]()
![]()

![]()
![]()
How can you find colleges that offer the best value in the long run? These 5 college statistics can help.
College is a big investment in time and money. After attending your first or second year of college, you don’t want to discover that your academic opportunities are not what you expected, that you can’t get into classes required for graduation, or that your financial aid decreases after freshman year. Any of these issues can add time and expense – not to mention stress – to your college experience.
How can you assess whether a college will be a good value in the long run? The clues lie in telling statistics about student outcomes that you can find in each College Profile on CollegeData. Here are 5 statistics you should look at for any college on your list — and before making your college choice.
1. Freshman Retention Rate
Retention rates measure the percentage of first-time undergraduate students who return to the same institution the following fall. Looking at the retention rate of a college helps you assess how happy students were with that college once they landed on campus.
According to a 2022 report by the National Center for Education Statistics (NCES), the average retention rate for all four-year colleges in 2017 was 81 percent. At the most selective colleges, those accepting less than 25 percent of applicants, the average retention rate was 91 percent compared to 62 percent at less-selective colleges.
Where to find freshman retention rates on CollegeData:
Using New York University as an example, go to its college profile and select “Students,” as shown below. You can access the college profiles by entering a college name in the search field on the homepage, or in College Search.

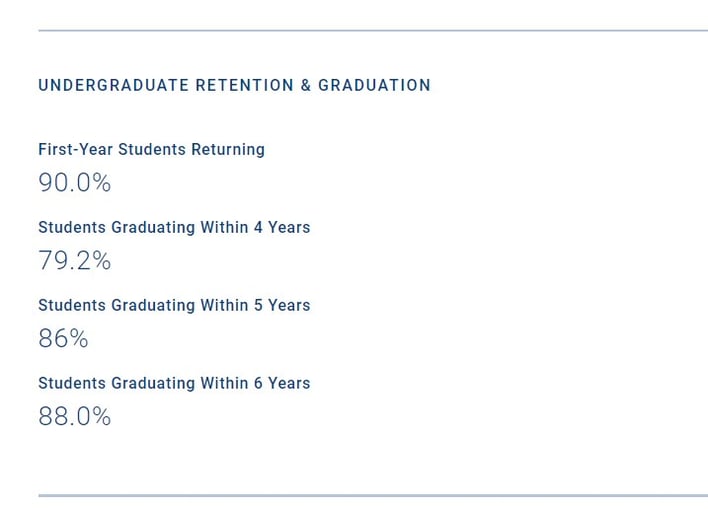
Scroll down to Undergraduate Retention & Graduation and you’ll see the percentage of students who returned to the college after freshman year. The example below (featuring from the 2020-2021 academic year) shows a 90 percent freshmen retention rate for NYU, which is above the national average for selective colleges.
2. Graduation Rate
Generally, the longer you take to complete your degree, the more it will cost in time and money, so it can be helpful to review a college’s graduation rate. Most students expect to graduate in four years, but it may take longer for a variety of reasons. According to the NCES, of students who began college in 2015, 44 percent earned their bachelor’s degree in four years, while 62 percent earned their degree in six years.
If you see a low graduation rate, it could mean that a high percentage of students change majors or transfer out, encounter financial or academic challenges, are unable to get into the classes they need to graduate, or are not motivated to continue their learning for any number of reasons.
Where to find graduation rates on CollegeData:
Again, using New York University as an example, go to its college profile and under “Undergraduate Retention & Graduation," you’ll see the four-year, five-year, and six-year graduation rates.

NYU’s profile shows four-year and six-year graduation rates of 76.4% and 85% respectively. These are well above the national average.
3. Employment and Grad School Stats
Look at the percentage of grads offered full-time work within six months of graduation and the average salary for this group as well as the percentage who pursued advanced study after graduation.
Where to find post-graduation statistics on CollegeData:
Again, using New York University as an example, go to its college profile and under “Students,” scroll down to “After Graduation” at the bottom of the page.

You’ll see that 88 percent of graduates were offered full-time employment within six months of graduation, at an average starting salary of $64,895. Another 12 percent went to graduate school.
4. Average Student Debt
On average, about two-thirds of students graduate with debt, averaging $28,950, according to the Project on Student Debt. CollegeData’s college profiles include both the percentage of students who took out federal loans and the average dollar amount they owed at graduation. High loan amounts can be a red flag that the college doesn’t provide enough grant and scholarship aid to cover college costs.
Where to find average indebtedness of graduates on CollegeData:
Using UCLA as an example, go to its college profile and select “Financials” as shown below:

Scroll down to the financial aid section. Just above the data on financial aid programs, you’ll see the percentage of students who took out loans and the average debt carried by graduating students.

In the example above, 40 percent of graduating students at UCLA had loan debt. Their total debt averaged $21,441. Note that the reported figures are based on loans the college includes in its aid packages. It does not include private loans or loans obtained by a student's family.
5. Average Gift aid awarded
Gift aid (another term for grants and scholarships) reduces college cost. Self-help aid (another term for loans and work-study) does not. Unlike loans and work-study, gift aid doesn’t have to be repaid or earned through a job.
Colleges may award gift aid based on a student’s financial circumstances (this is called need-based gift aid) or based on a student’s grades or special talents (merit-based gift aid).
It’s a good idea to see how generous a college has been with gift aid throughout all years of college, not just freshman year. Some colleges reduce the amount of gift aid after freshman year and award more in self-help aid (loans).
Where to find gift aid averages on CollegeData:
Again using UCLA as an example, select “Financials” from its college profile and scroll down to “Profile of 2018-19 Student Aid" and you’ll see the data for need-based gift aid and merit-based gift aid, first for freshmen and then for all undergraduates.
Let’s look at the freshman data for UCLA, located under “Average Award.”

Under the heading "Need-Based Gift" you'll see that 97 percent of aid recipients received grants and scholarships averaging $21,621. About 52 percent of aid recipients received self-help aid (loans and work-study), averaging $7,168.
Under the heading “Merit-Based Gift” you’ll see that a small percentage of aid recipients (3.6 percent) received merit scholarships. The next line states that 3.1 percent of freshmen had no financial need and received merit scholarships averaging $6,022. This statistic is important if your family does not qualify for much – or any – need-based financial aid.

When we scroll down to “All Undergraduates,” we see similar averages for gift aid awarded to all undergraduates, which is a good sign that your scholarships and grants won’t decrease significantly after freshman year. Keep in mind, of course, that every student’s financial aid picture is different, and the amount of financial aid a student receives depends on many factors.

Which Colleges Offer the Best Value?
As you make your college list — or your college choice — you’ll consider many different factors related to your day-to-day college experience. But don’t forget to look into your future, at the results you’d like to see after getting your degree. These five college statistics can show you how well students fare post-graduation and help you uncover what might be your best-value colleges.